Business
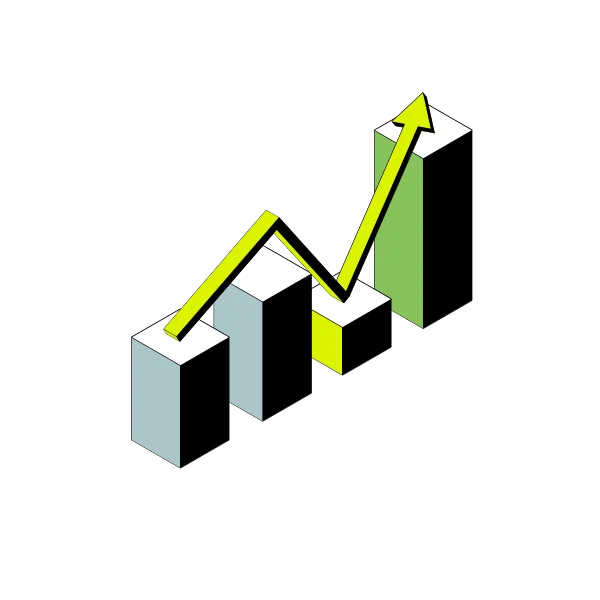
Isometric Bar Chart Illustration
A clean isometric bar chart graphic for analytics, reports, dashboards and business presentations.
Download the SVG for the standalone asset, or build a larger scene in the isometric illustration maker.
Business
A clean isometric bar chart graphic for analytics, reports, dashboards and business presentations.
Download the SVG for the standalone asset, or build a larger scene in the isometric illustration maker.
Common uses
Customize it
Use the chart as a visual reference for a data scene, then combine bars, labels, text and other isometric shapes in the editor to match your product or brand.
Open the editorKeep browsing